- Tech Savvy Mag
- Wi-Fi and Routers
- Using a Wi-Fi analyzer app to find the best spot for your router
Using a Wi-Fi analyzer app to find the best spot for your router
A free Wi-Fi analyzer app helps you find dead zones, dodge crowded channels, and place your router in the best spot for a strong signal in every room.
Explained by Beatrix Aldridge
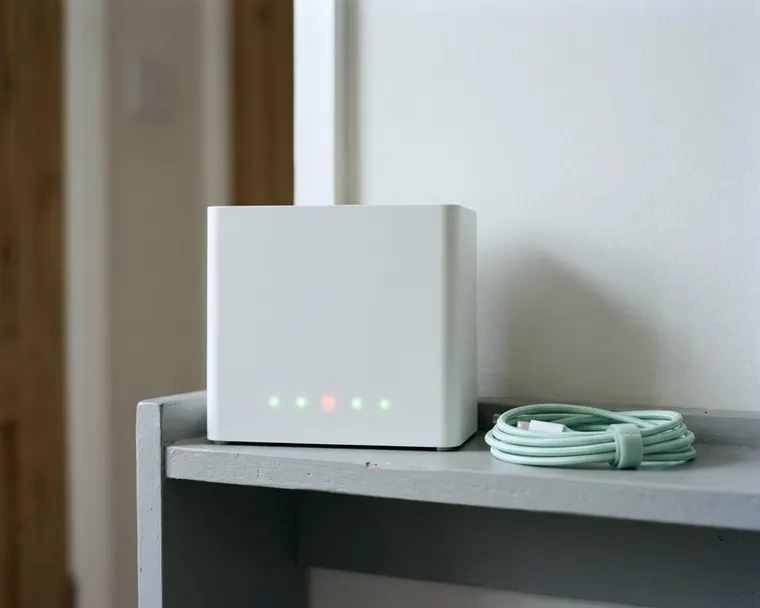
A free Wi-Fi analyzer app turns your phone into a signal meter to map out dead zones in your house. You can use it to run a Wi-Fi strength test in different rooms, find crowded channels, and decide exactly where to place your router for a solid connection.
What a Wi-Fi analyzer app measures
The standard icon on your phone screen only shows a vague idea of your connection. A Wi-Fi analyzer app shows you the invisible radio waves filling your home. It reads the raw data coming from your router and translates it into a detailed visual chart.
You see exactly how strong the connection is at any given spot. The app also detects other networks broadcasting nearby. It picks up the signals from your neighbors, nearby businesses, and even stray devices like wireless printers.
Routers send out signals on different frequency bands. A lower frequency band generally travels farther but carries data more slowly, while a higher frequency band generally carries data faster but struggles to cross long distances. The analyzer app separates these bands into different screens. It shows you exactly which band your phone is listening to.
The most useful feature is the channel graph. Routers divide the frequency bands into distinct channels to keep traffic organized. The app displays these channels along the bottom of the screen and draws a colored curve for every network it finds. You can see how many overlapping curves sit on top of your own network, revealing interference that a standard connection menu hides.
Walk the house and note the weak rooms
Mapping your home takes a slow and deliberate pace. Open the app and stand right next to the router to get a baseline reading. Watch the graph peak at its absolute highest point. This is usually the strongest signal your equipment delivers.
Begin walking away from the equipment at a slow crawl. Keep your eyes on the screen and watch how the graph changes. The line will drop as you put distance between yourself and the source. Stop walking periodically and wait for the app to display the most accurate reading.
Head into the rooms where people actually use their devices. Stand next to the living room couch and check the reading. Sit at the office desk and hold the phone exactly where a laptop normally rests. Test the kitchen counter and the bed in the furthest bedroom.
Shut the interior doors and see how the wood affects the graph. Make a mental note or draw a simple map of the spaces where the line plummets. You are looking for sharp drops that happen abruptly.
A room that seems close to the equipment might show a terrible reading because of a hidden obstacle. This methodical walk shows you where the signal weakens. It helps you figure out if a device keeps dropping the connection because of a hardware flaw or if your Wi-Fi is slow simply because the waves cannot reach the room.
Do not forget the exterior spaces around your property. Walk out to the back porch and see if the connection reaches the patio furniture. Head into the garage to check the signal where the car parks.
Smart garage door openers and outdoor security cameras require a solid connection to function properly. The app can show you where the signal weakens in the yard. Knowing the perimeter of your network prevents you from installing outdoor devices in blind spots.
Read signal strength in plain terms
Reading the graphs in a Wi-Fi analyzer app takes a little adjustment. The signal strength is measured in negative units, meaning the scale works backwards from what you might expect. A line reaching higher toward the top of the chart represents a stronger connection. A value that moves further down into the negative range indicates a failing signal.
Most apps draw a line graph or a dial to help you visualize this negative scale. A line sitting near the top of the chart means your devices can usually stream video and download large files with little hesitation. When the line dips into the middle of the chart, the connection remains stable but speeds might slow down slightly.
A line hovering near the bottom of the chart means the signal is barely hanging on. Devices in this zone may struggle to load basic web pages. Smart home gadgets may drop offline often. Running a Wi-Fi strength test while watching this line teaches you the true boundary of your network.
You will notice that the line never sits perfectly still. It constantly bounces up and down as the radio waves react to movement in the house. People walking through the room will cause the line to flutter. Focus on the average position of the line rather than the tiny fluctuations.
Understanding the graph helps you manage expectations for different devices. A smart thermostat often needs less signal to report the temperature. A television streaming a movie needs more data and a stronger reading on the graph.
When you look at the line dropping in a room, consider what devices live in that space. A weak reading in a hallway might not matter at all. A weak reading in the main family room is worth fixing first.
Spot a crowded channel and switch it
Interference is a common problem for home networks. Internet providers often give similar default equipment to many homes on the street. Those routers can end up on the same default channel.
The channel graph in your app can show this congestion clearly. You will see a tall curve representing your network. If your neighbors are using the same channel, you will see their curves stacked directly on top of yours.
The airwaves act like a shared lane on a highway. When too many networks try to use the same lane, the equipment has to take turns sending data. This waiting process can cause lag on your devices.
Look across the horizontal axis of the graph to find empty space. You are searching for a channel with no colored curves, or at least a channel where the curves sit very low to the bottom. A flat section of the graph represents clean airwaves.
To fix a congested connection, you must switch your router to that empty lane. Open a web browser on a connected computer and type in the administrative address printed on the sticker attached to the router. Log in with the administrator password.
Find the wireless settings menu and locate the channel selection dropdown. Change the selection from automatic to the specific channel you found in the app. Save the settings and let the router reboot. Open your analyzer app again and watch your network move into the clean space.
Sometimes the interference does not come from a neighbor. Household appliances can ruin a clean channel. Microwave ovens can give off radio waves while heating food. Some baby monitors and cordless telephones use frequencies that overlap with your network.
If you notice the graph in your app dropping wildly at certain times of the day, someone might just be heating up lunch. Use the app while the microwave is running to see if the interference spikes. If it does, you will know to move the router further away from the kitchen.
Move the router and test again
The location of the router dictates the shape of your network. The internal antennas broadcast radio waves in a sphere that pushes out in every direction. Placing the equipment against an exterior wall can send much of your signal out into the yard.
Sticking the router in a basement corner can send much of the signal into the ground. Find a central location on the main floor of your home instead. You want the equipment to sit as close to the middle of the house as possible.
Height often helps. Place the router high up on a bookcase or mount it on a tall shelf. Raising the equipment lifts the signal over dense furniture and keeps it away from the floorboards.
Avoid hiding the router out of sight. Shoving it inside a wooden entertainment center can muffle the broadcast. Dropping it behind a television may add interference. Keep the router out in the open where it can breathe.
Once you move the equipment to a better spot, open the app and perform another sweep of the house. Walk back to the dead zones you mapped out earlier. Check the graph to see if the signal line sits higher on the chart.
Turning the router to face a different direction or sliding it to the other edge of a shelf can bend the signal into a stubborn room. Test the connection after every physical adjustment.
Know when walls, not settings, are the problem
Sometimes a perfect channel and a central location fail to fix a dead zone. The physical materials building your home absorb and reflect radio waves. The app helps you prove when the house itself is the enemy.
Wood and plain drywall usually let signals pass through more easily. Heavy, dense materials can act as a shield. Brick fireplaces can block signals.
Stand in front of a brick chimney and look at the graph in your app. Walk to the opposite side of the chimney and watch whether the signal strength drops. The app creates a clear picture of the shadow cast by the masonry.
Metal is a common offender. Large appliances like refrigerators and ovens can block much of the signal. Foil-backed insulation inside the walls may trap the waves inside a room.
Even a large bathroom mirror may reflect the signal. Fish tanks and thick concrete walls can absorb the waves and leave the rooms behind them with a weak signal.
Plumbing can also create dead zones. A bathroom placed directly between the router and a bedroom creates a wall of water pipes and porcelain. Water can absorb radio waves. The app may show a sharp drop in signal strength behind the bathtub or the hot water heater.
No amount of tweaking the router settings may force a signal through a metal refrigerator or a solid brick wall. The analyzer app saves you from chasing false hopes. When you see the graph drop immediately behind a physical barrier, you know you have to route the signal around the obstacle.
This is the moment to look into additional hardware. You might need to add a wired access point or see if Wi-Fi extenders work for your specific floor plan. Placing an extender where it still gets a good signal can help the connection reach past the obstacle.
The diagnostic work you did with the app tells you exactly where the obstacle lies. This helps you place any new hardware in a better spot to catch a strong signal before it fades. Relying on the app removes much of the guesswork.